
What a century of market history can tell us about elections and uncertainty.
The short answer: the market history of the last 100 years, from my perspective, does not give a dependable reason to buy or sell around an election. Dimensional’s research found no clear pattern by party, and election months have been spread across the full range of results. What can reasonably change your portfolio is a change in your own situation, such as when you’ll need to take the money out or how much risk you can live with.
Election season can make leaving your investments alone feel a little irresponsible. You're paying attention and you have real concerns about the country, and somewhere between the campaign ads and the market commentary it starts to seem reasonable to do something with your money before the results come in.
That feeling deserves a thoughtful answer. The decisions coming out of Washington can affect your finances, and caring about them makes sense.
The harder question is whether those concerns tell you anything useful about how to manage your investments. To look at it, I read Dimensional Fund Advisors’ research from several election cycles. The history shows some patterns worth understanding, along with clear limits on what they can tell us.
I’ve been working with investors since 2014. In that time I’ve been through three presidential elections and now three midterm cycles.
If you knew who would win, would you know what to do?
A forecast about an election has a clear finish line, since someone wins and someone loses. An investment decision keeps going past election night. You would have to anticipate which policies actually take effect and how businesses and consumers respond, then judge how all of that compares with what investors already expected.
After that comes the timing: if you sell, you eventually face the question of when to buy back in.
Dimensional's September 2024 article on presidential elections describes why this is so hard. Market prices incorporate the collective expectations of millions of investors, so election news gets absorbed into a process that is already running, alongside everything else investors are weighing.
Markets don’t know everything, per se (but they are incredibly efficient), and expectations can change abruptly. Even so, a widely discussed political worry is unlikely to be information that only you have noticed.
Dimensional's October 2026 midterm article offers an example from 2016. It notes that many articles published before that election suggested stocks would fall if Donald Trump won, such as a CNN Money piece headlined "A Trump win would sink stocks." On the day after his victory, the S&P 500 closed 1.1% higher. One day of trading tells us very little about an administration's stock market effects, but it is a clear case of how a correct prediction about the election could still have led to the wrong trade.
Do stock returns look different in election months?
Dimensional looked at monthly S&P 500 returns going back to 1926 and marked the months that contained midterm elections. Those months fell throughout the usual range of results, with no clear pattern based on which party won.¹
Exhibit 1 in Dimensional’s article (below) shows it directly: every month since 1926 sorted by its return, with the midterm months marked by which party won.
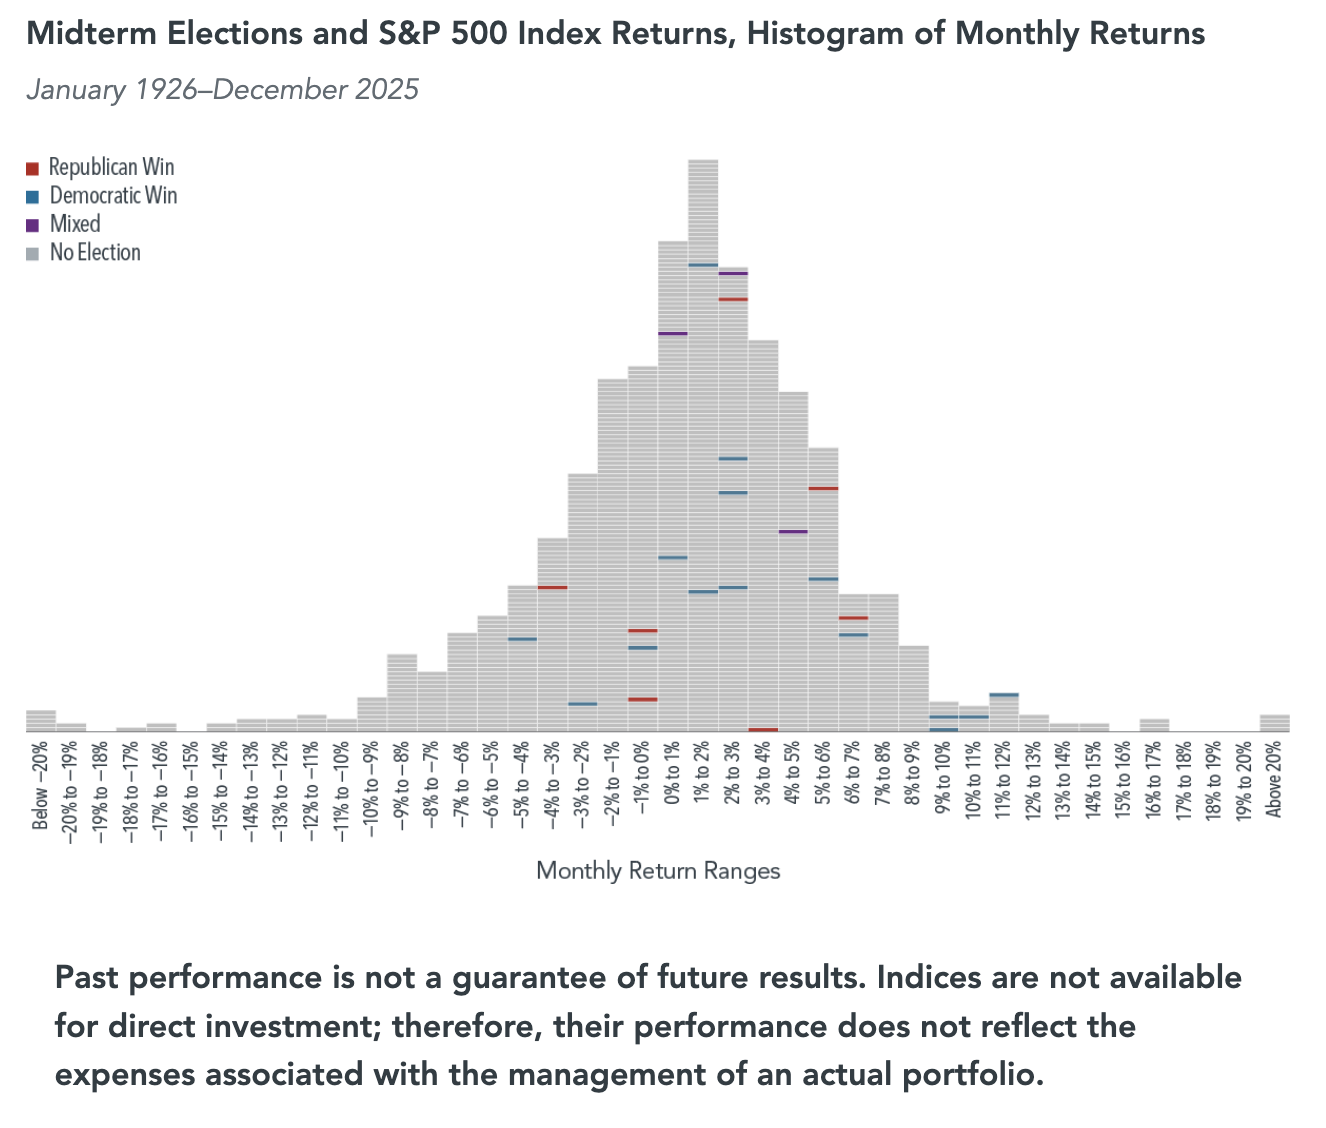
Source: Dimensional Fund Advisors, Midterm Elections: What Do They Mean for Markets? (October 2026). Past performance is not a guarantee of future results.
The bottom line is that if you're trying to make investment decisions based on the results of a midterm election, you're essentially just playing a guessing game.
Which party is better for the market?
This question gets a lot of attention because it seems like the answer ought to be useful. If one party's years produced better returns, we could act on that the next time it wins. Dimensional's 2024 article, "Bulls, Bears, and Ballots," looked at this question and found that stocks haven't shown much of a party preference, and that control of Congress hasn't been a reliable market gauge either.
The chart in Dimensional’s 2026 midterm article (Exhibit 2) traces the growth of $1 in the S&P 500 since 1926 alongside which party controlled Congress. Both parties presided over stretches of strong growth and sharp declines, and Dimensional found no pattern of stronger returns under any particular arrangement.

Source: Dimensional Fund Advisors, Midterm Elections: What Do They Mean for Markets? (October 2026). Hypothetical growth for illustration only. Indices are not available for direct investment.
My own read is that assigning market returns to a party gives the party more credit or blame than it likely deserves. An administration inherits an economy that is already in motion, with market valuations and problems that were developing before it arrived. Events during its term can have causes that reach back years, and businesses adapt to conditions in ways a political forecast may not anticipate. A party average, even a correctly calculated one, can't separate those influences. It describes what happened while someone held office. Explaining why it happened is a much larger task.
You don't have to feel good about the news to remain invested
This may be the most personal part of the topic. Election concerns can be bound up with your family and with values you care about deeply. A chart is unlikely to settle those feelings, and it shouldn’t be asked to.
In a November 2024 article, Dimensional's Wes Crill used the pandemic recovery as an example of how markets can improve while the world still feels frightening. By his account, the MSCI All Country World IMI Index returned nearly 74% from the market's low on March 23, 2020 through the end of that year. The index had fallen sharply in the weeks before that low, and the low is only obvious in hindsight. Nobody should count on being able to identify a bottom in advance. What the example does show is how far apart the emotional experience of a period and the returns that follow it can be.
Waiting until you feel comfortable creates its own difficult decision. What would have to happen before you felt ready, and if prices rose in the meantime, would you still be willing to buy?
A plan has to make room for stretches when the news is upsetting and the outcome is still unresolved. If staying invested depends on reassurance, that reassurance may arrive only after prices have already moved.
Where this leaves things
The history I looked at gives no reliable signal about when to buy or sell around an election. Election months have been spread across the full range of results, and party control hasn’t shown a clear pattern either.
What remains are questions that don’t depend on who wins, such as when you will need the money and how large a decline you could live with. Actual policy changes are a separate matter. When a new rule takes effect, how it touches your own finances can be worked out from the details at that point, without anyone having to predict how the market will react.
Your money has to support your life through many changes in Washington. That is a good reason to think about it on a longer horizon than any single election.
If this election season has you wondering whether your portfolio still fits your life, that’s a good conversation to have before you make a change. I work with business owners and professionals on exactly those questions, like when they’ll need their money and how much of a decline they could live with. If you’d like to talk yours through, you can schedule an Exploration Call, a relaxed 30-minute conversation to see whether working together makes sense.
Last reviewed October 2026.
Sources
Dimensional Fund Advisors. "Presidential Elections: What Do They Mean for Markets?" September 30, 2024. Election-month analysis covers January 1926 to December 2023.
Dimensional Fund Advisors. "Midterm Elections—What Do They Mean for Markets?" October 21, 2026. Exhibits 1 and 2 begin in January 1926.
Dimensional Fund Advisors. "Bulls, Bears, and Ballots: When Looking at Politics and Markets, Think Long Term." 2024.
Wes Crill, Dimensional Fund Advisors. "Election Results Shouldn't Dictate Your Investments." November 19, 2024. The pandemic-recovery example uses the MSCI All Country World IMI Index from March 23 through December 31, 2020, as reported by Dimensional.
BBC News. "Wall Street surges after Trump victory." November 9, 2016. The S&P 500 closed 1.11% higher at 2,163.26.
This post is for informational and educational purposes only. It is not individualized investment, tax, or legal advice, and it is not a recommendation to buy, sell, or hold any security. Investing involves risk, including the possible loss of principal. Past performance does not guarantee future results. Third-party data and research in this post come from the sources cited above. Index returns are shown for general market context only, and indexes are not available for direct investment.
1. Dimensional Fund Advisors, "Midterm Elections—What Do They Mean for Markets?", October 21, 2026.